Content marketing is an increasing priority for companies trying to generate new leads. They’re writing more blogs, publishing more social media posts, sending more emails. You may feel like you’re already a never-ending content machine, but it’s time to step back and evaluate all that effort. Is what you’re doing actually paying off?
If not, or if it could be better, we encourage you to consider using marketing infographics. Eye-catching, easy to read, and crazy sharable, content marketing infographics are a way to maximize your current strategy so that you can improve your bottom line.
Which Section Do You Want To Read First?
Want a Marketing Infographic about Marketing Infographics?
Of course you do…

2 Marketing Infographic Case Studies: One Generated $300,000!
If a picture is worth a thousand words, then a marketing infographic could be worth $300,000. Or, at least it was in the case of one of our clients.
- 398% growth in organic Google search traffic
- Client secured a $300,000 contract as a result of infographic article
- Top press mentions and high-quality SEO backlinks from Entrepreneur, Small Biz Trends, and ProProfs
We also practice what we preach. And just in case you haven’t joined the choir yet, here’s how infographics helped improve our own leads and sales.
- 1,290% growth in organic Google search traffic
- 136% growth in email leads
- Top press mentions and high-quality SEO backlinks from Smart Insights, Social Media Today, Undercover Recruiter, and Small Biz Daily
Why Use a Marketing Infographic? 11 Bankable Benefits

From blogs to social media to email and everything in between, you and your customers have no shortage of information. Whatever you need to know is available 24/7 and in a moment’s notice. The problem then becomes how to make that information easy to find, engaging, and digestible for your audience. In short, it has to meet their needs.
Marketing infographics that are well designed and follow best practices check all of those boxes. And even better, they can generate high-quality leads and high-dollar sales for you. Take a look at why infographics need to be a part of your content marketing strategy.
- A study by MDG Advertising reveals that articles containing images get 94% more views
- Over 40% of marketers said infographics and illustrations were their highest performing content in a study done by Venngage
- HubSpot’s research showed infographics as the fourth most popular type of content
Now, let’s talk about how content marketing infographics can benefit you.
1. Reach a visual audience

From photos to videos to infographics and more, content marketing is moving in a visual direction. In fact, you’ll be hard-pressed to find content from big brands that doesn’t include some sort of visual element.
And there’s a simple explanation for it: According to a study referenced by Poll Everywhere, 91% of people “prefer visual and interactive content rather than traditional formats.” That’s a hard statistic to ignore, and it means that you need to get on board or risk getting left behind.
2. Increase targeted website traffic
It’s a search engine’s job to help people find exactly what they’re looking for as quickly as possible. And because infographics are SEO-friendly, eye-catching, and highly sharable (more on all this below), they can help the right people find you. For this reason, it’s important to create targeted infographics that will interest your intended audience, but once they show up, they’ll likely be invested in what you have to say.
3. Receive qualified leads
Building on the last point, having an increase in targeted website traffic naturally leads to receiving more qualified leads. Yes, you want more traffic and more leads, but to benefit your company, they need to be the right people. Adding infographics to your inbound marketing strategy can attract those who are most interested in working with you or buying from you.
4. Boost sales—yes, really!

Don’t forget about those two case studies at the top! Using infographics in your marketing strategy has enormous potential for your bottom line. In benefit #2 you saw that you can increase targeted website traffic, and in benefit #3 you learned that you’ll receive more qualified leads. Those both add up to more sales for your company. That’s the kind of natural by-product you want. And it can happen by creating just a few, focused pieces of content, rather than endlessly churning out high volumes of blog content that people might not read.
5. Generate SEO traffic and quality backlinks
Whether you’re advanced in search engine optimization or just getting started, one of the ways you’ll want to maximize your marketing infographic is by making it SEO-friendly.
Having Google send traffic to your website on autopilot because of your infographic is a terrific, long-term strategy—outside of your own promotional efforts, of course. Additionally, when others are able to easily find your infographic, and it provides them with value, they’ll share it and you’ll get more backlinks from their website and social media.
And this will further increase your website’s rankings.
6. Expand PR efforts

The line between different forms of business communications is becoming increasingly blurred, especially online, and marketing infographics can actually be a valuable asset to your public relations strategy. Two examples include linking infographics in your press releases and receiving mentions (and links) on highly reputable sites.
7. Establish bona fide credibility
It doesn’t matter if your company is made up of one individual or tens of thousands, you’re in business to be seen as a thought leader in your industry. Infographics allow you to position yourself as a trusted thought leader or subject matter expert because they demonstrate knowledge, authority, and the ability to convey information in a concise and engaging format.
8. Make content more shareable

Every content marketer wants to create information that is more likely to be shared by their audience. You want your content to be so compelling that others just can’t help themselves—they have to share it with the world. Infographics can help make that dream a reality. According to an analysis of 100 million articles done by BuzzSumo, infographics received more shares than any other type of content.
9. Make messaging stickier and easier to remember
Are you trying to teach your audience something, or have them retain the information you provide? If so, infographics should be part of your content strategy, even if you’re using video. Brain Rules noted that people only retain 10% of information they heard three days later, as opposed to retaining 65% when the information was paired with an image.
10. Visually stunning on social media
We’ve mentioned blog content several times already, but don’t forget to include social media marketing infographics in your promotion strategy. In fact, it seems like infographics were practically made for social media, doesn’t it?
When people are endlessly scrolling through Facebook, Twitter, Instagram, LinkedIn, or Pinterest, infographics are an easy way to grab someone’s attention. They may need to be formatted a little differently for each platform, but they’ll make your marketing go even further.
11. Present complex information in an easy-to-digest format

t should go without saying, but we’ll include it for good measure: Marketing infographics are a fantastic way to communicate a lot of data or complex information in an easy-to-read format. Outside of what infographics can do for your company, they provide the knowledge that your audience is looking for in a layout that’s super simple to understand.
And they’ll thank you for that.
13 Tips for Creating Stellar Content Marketing Infographics

You’ve no doubt seen content marketing infographics sprinkled all around the Internet, which may make you think you’re ready to create your own. However, before you dive in, here are 13 best practices you should be aware of to make the most of your time and effort.
1. Avoid the temptation of a template

It might be tempting to use a template when trying to design your digital marketing infographic, but that route may not serve you well in the long run. Why? There are two primary reasons. First of all, you might feel constrained to fit your content exactly into someone else’s template. That means you might leave out crucial information or add fluff you didn’t originally intend. Second, using templates would mean that your infographics look just like everyone else’s—and then it might not get noticed at all.
2. Think quality over quantity
Using infographics in marketing isn’t a gimmick, it’s a strategy. So, each one you create should represent not only your content, but intention and thought. Start with one longer infographic of 7 to 10 panels. Assess it and get feedback before moving on.
Having a high-quality, long-form infographic is much better than producing 10 with one to two panels that are just okay.
3. Think long-term gains over short-term cost
As with all things in marketing, you want to prioritize ROI over initial cost when you can. Remember those examples above? When done well, infographics and content marketing can have a huge effect on your bottom line.
Just know that stellar digital marketing infographics can cost a few thousand dollars each because they are custom-made, designed to utilize every centimeter of real estate, strategic in purpose and execution, and designed to maximize PR and SEO links from media sites.
4. Research comes first, always!

Start with careful research before you ever start writing your infographic. Review 10-20 examples on the exact same topic (and even a few related topics) to see what you’re competing against.
Pro tip: Use Google to search for “topic + infographic” or, alternatively, Buzzsumo with the topic selected and “infographic” as a selector.
5. Develop an in-depth outline
Your article isn’t the only thing that needs an outline; your infographic does, too. Think about what sections you’d like to include and any visuals you foresee. Don’t expect the designer to do this entirely on their own.
You as the marketing professional should drive the content and creation from all angles. And, if you don’t know what to include in your infographic outline, go back to best practice #3 where you look at examples from others. It’s okay to let inspiration be your guide.
6. Select an experienced infographic designer
Many experienced designers may think that they can create infographics for online marketing, but that’s not true. You need someone who has experience with a number of longform infographics because only they know how to design in such a way that will convince major influencers to share and link. It’s a specialized skill, and one worthy of your consideration. While it can certainly be learned, there is a steep learning curve.
7. Make it eye-catching and truly engaging
This might seem like an obvious point, but too many infographics fall flat when it comes to design. Beware of a design that is too clip art-looking or has too much information jammed into the panels. This is especially important for a social media marketing infographic.
Less is more here: less text and more images. Keep a large amount of whitespace or negative space so that the eye has room to flow from one item to the next. Your goal should be to tell a cohesive story from top to bottom, with panels that flow logically from one to another and make sense to readers.
8. Variety is the spice of life—and of infographics
Speaking of flow, each section should also look different and use a variety of ways to tell your infographic’s story. This visual interest will keep someone’s eye moving down the design and engage them to keep reading for what’s next. Even if they’ve already read your accompanying blog post, this format will present the information in a new way.
A few tools to consider are:
- Statistics
- Charts (“The American Dream”)
- Roadmap steps
- Comparison columns
- Tables (#2)
- Quotes
- Graphs (#1)
- Icons (#17)
- Country map
9. Select the right topic that fits your business goals
As a marketer, you likely always have your eye on ToFu, MoFu, and BoFu, or top of funnel, middle of funnel, and bottom of funnel. Each stage is an important one in your customer’s journey, and knowing how your infographic topic fits into that process is crucial for its success.
Nurturing someone along the path to conversion takes careful thought and a defined strategy, and your infographic can either help that decision—or not—based on your planning (or lack thereof).
10. Keep branding in mind
Using infographics in marketing is only effective if they look synonymous with your brand. Slapping a logo on there somewhere won’t get the job done if you want someone to remember that it came from you. Utilize your brand’s fonts, colors, and tone on the infographic to align with the rest of your site. Hopefully, your infographic will get shared far and wide, so people should recognize it as yours when they see it.
11. Give credit where credit is due
The same way you want someone to give you credit for your thoughts, ideas, and even your infographic, you want to pay others that same respect. If you use other people’s research or statistics to create your content marketing infographic, be sure to cite them at the end. Both in the infographic design itself as well as at the end of the article.
Giving credit like a journalist is not only a best practice, but keeps your reputation intact. Who knows, the person or company you credited might also be willing to share your infographic with their audience!
12. Promote, promote, promote … then promote some more! at the end of the article

Ever heard of the Pareto Principle or 80/20 rule? Economist Vilfredo Pareto is credited with the notion that 80% of your results come from 20% of your efforts. The principle has been applied to many industries over the years, including content marketing. It’s not a perfect equation, but for our purposes, it means you should spend far more time marketing your infographic than you did creating it. After all, for the time and expense you put into its design, you want to make sure people see it.
So, promote the heck out of it! Send it out via email, adapt it as a social media marketing infographic, and also target influencers who’ve shared infographics on the same topic. Don’t just assume people will see it and share it. That’s not a good marketing strategy, in general, and it certainly won’t work here either. You’ll need to do a lot of work to get people to share it, but when they do, you’ll see the results.
13. Consider interactive infographics
Infographics in online marketing are getting an upgrade. Just as we’ve seen a shift from plain text blogs to blogs with images to blogs with videos, we’re seeing the rise of interactive infographics.
Static infographics certainly get the job done for now, but if you want to wow, consider interactive infographics. Talk about creating engaging content! Giving people the opportunity to play with and manipulate your infographic means they’re spending more time learning from you.
12 Top-Notch Examples: Infographics We’ve Created
By now you understand the benefits of creating digital marketing infographics and have learned the best practices. However, before you set out to create your own dynamic versions, we thought it would be helpful for you to see a few examples in action.
Here are 12 content marketing infographics that we created for ourselves and clients to inspire you and further guide you. Though your industry or business model may be different than the examples below, we encourage you to examine each of them to look for ideas that you can apply to your own company. Some of these are B2B focused and some are B2C. Others are nonprofit and some are for-profit companies. Don’t gloss over ones that may be different than your company is, take a look as you will find things that apply regardless.
And let us know which infographic was your favorite or inspired you the most by leaving us a comment at the end of the article!
1. Mr. Rekey’s Home Inspection Guide

Buying or selling a house can be an incredibly stressful experience, and costs can add up quickly. Mr. Rekey’s uses this infographic to highlight the importance of having a home inspection, as well as the benefits to buyers and sellers. It not only positions him as someone who understands his industry, but shows how he adds (literal) value to customers’ lives. This infographic highlights the importance of having a home inspection and the benefits to buyers and sellers, which positions Mr. Rekey as someone who not only understands his industry, but shows how he adds (literal) value to customers’ lives. How can you use infographics to demonstrate your value?
2. The Quintessential Crowdfunding Guide for Nonprofits by Acendia
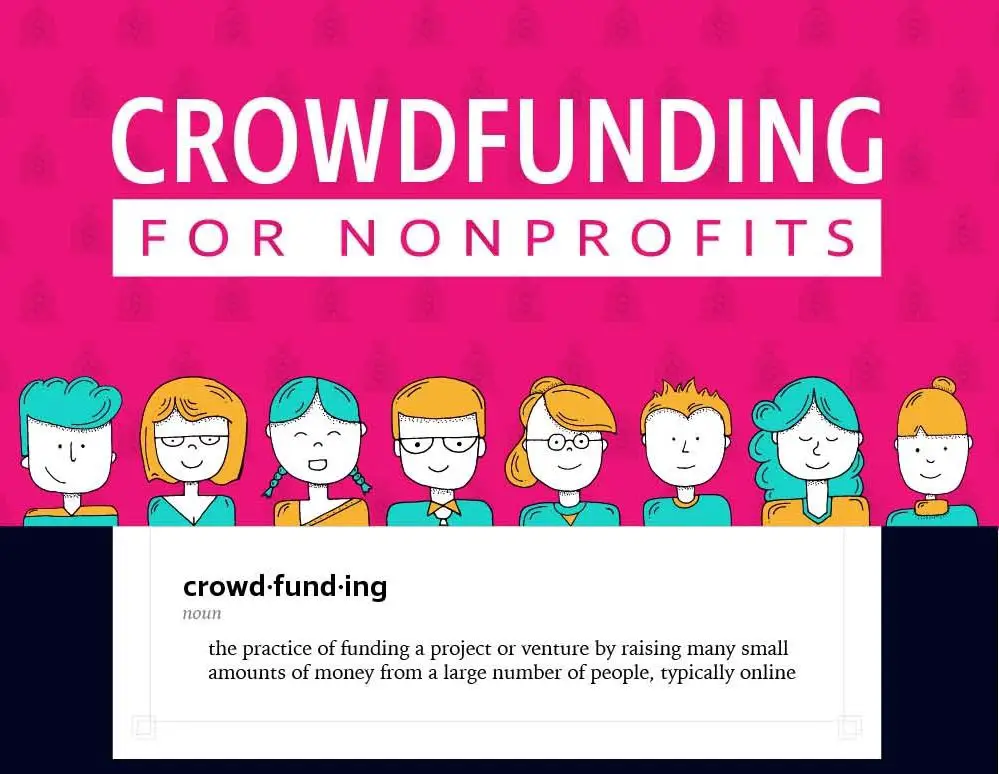
Crowdfunding is of interest to many nonprofits, but it can also be a complicated process and many nonprofit organizations don’t raise as much money as they’d hoped. This infographic does a terrific job of not only distilling information, but managing a nonprofit’s expectations for this form of fundraising. How can you break down complicated information for your readers?
3. The Ultimate Guide to a Rock-Solid B2B Marketing Strategy by Imaginasium
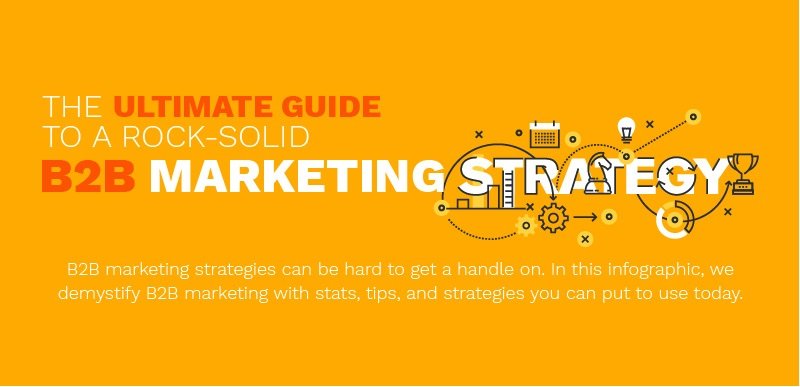
There is a lot of false information when it comes to marketing, and we at Imaginasium believe that you should always lead with data when it comes to your strategy. We create this infographic as the perfect companion to our blog post about marketing myths, concrete numbers and facts, and B2B digital marketing trends. How can you bring your content marketing to life with infographics?
4. Giving Tuesday Growth, Trends, and Opportunities by Ally360
Giving Tuesday is growing in popularity each year, and many nonprofits need assistance to execute a profitable campaign. In this instance, the infographic is used to make a great case for why nonprofit organizations should jump in, and how they can make their campaign a success—which Ally360 can help them with. How can you make the case for your products and services with a digital marketing infographic?
5. Future of Fundraising for Nonprofits by Acendia
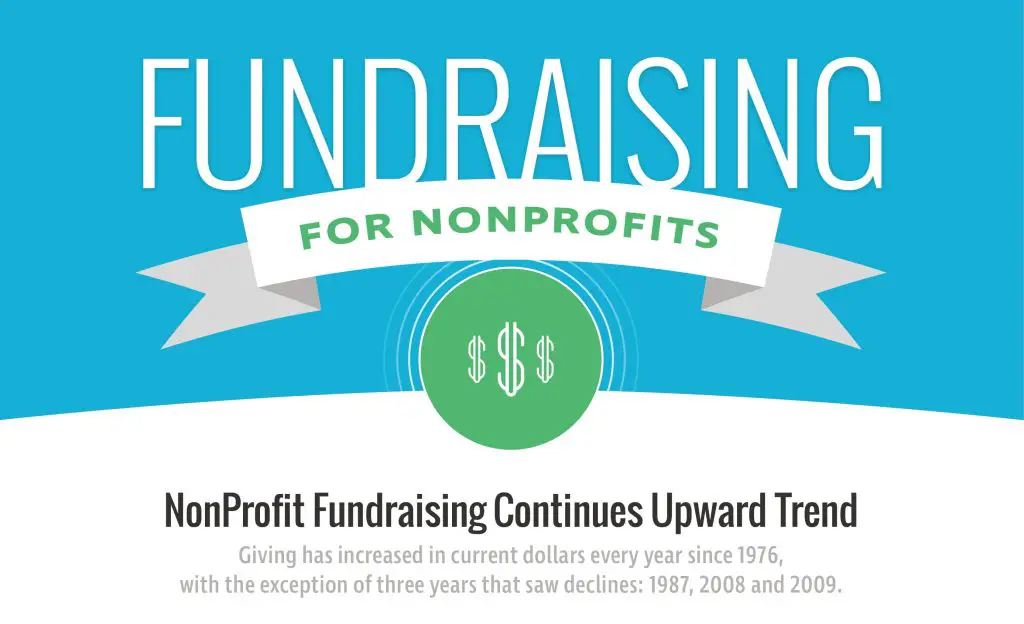
Fundraising is always a topic that nonprofit leaders stop to learn more about and pay attention to. This infographic reiterates where donations come from, who they come from, and how they come in the door. What topics are most important to your customers, and how can you address their questions with an infographic?
6. Mr. Rekey’s Locksmith Scam Survival Guide

There probably aren’t a lot of people who read up on locksmiths ahead of time. It often only becomes a concern when there’s a problem. Mr. Rekey’s infographic helps people protect themselves against potential scams. How can you convey urgent information to readers through infographics so that you become their hero? Enter your text here…
7. Six Ways Leaders Inspire Their Teams by InitiativeOne
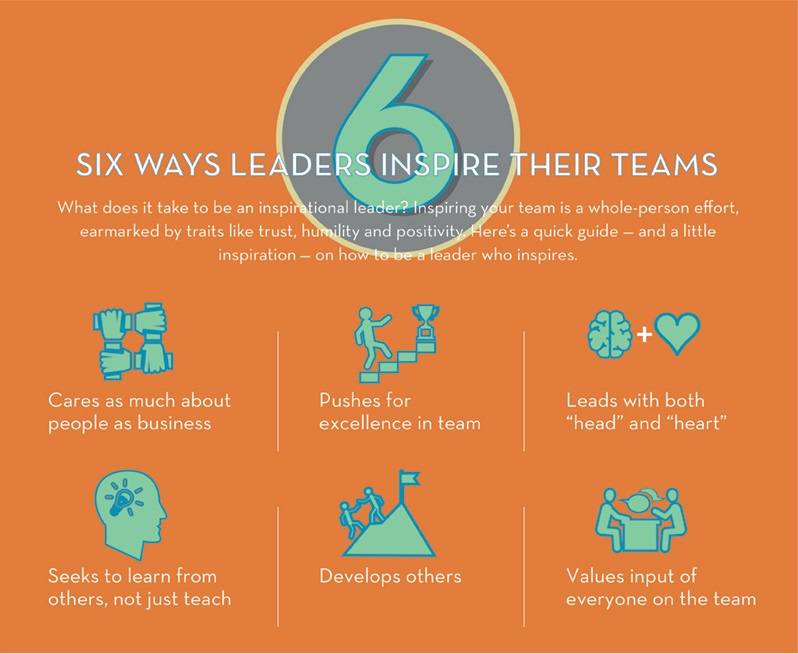
Most leaders love to learn, but they are also incredibly busy running a company. To make important information available at a glance, this infographic homes in on traits of inspirational leaders, provides examples to model, and gives warnings of how leaders can fail. How can your infographic provide desired knowledge in an instant for your readers?
8. Need for Employer Branding Greater Than You Think? by Imaginasium
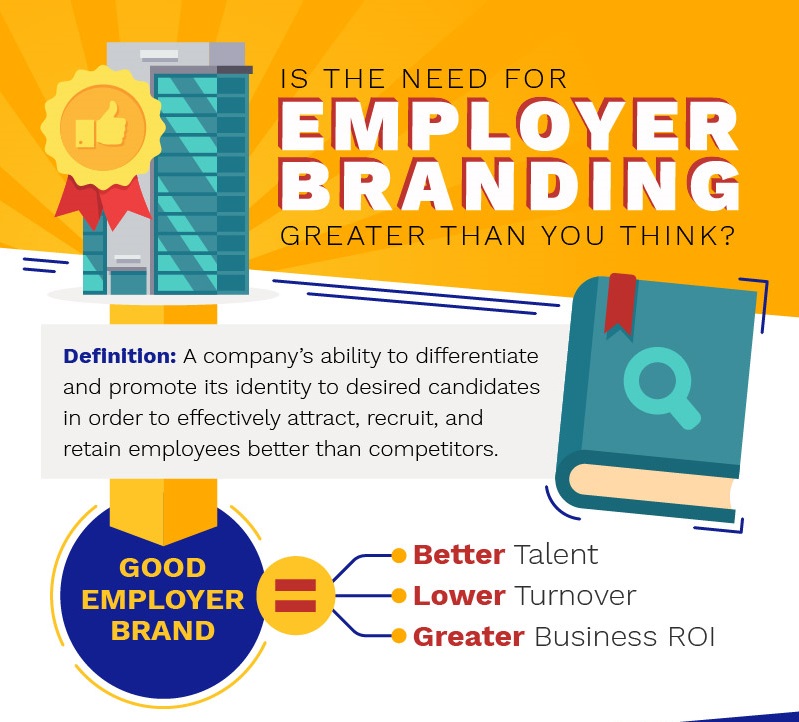
Each industry has its own vocabulary and jargon, which can sometimes be confusing or misinterpreted. An infographic like this one is helpful because it defines the term “employer branding” before jumping into why it should be important to companies and how to measure it. How can you become a resource for your industry with infographics?
9. The Ultimate Guide to Bullet Journaling: History and Future by C.R. Gibson

Bullet journaling is more popular than ever, but there are a lot of questions about exactly what it is and how to do it correctly. Infographics are a great way to summarize new and highly-searched trends, and this one covers where bullet journaling came from, a few myths, and how to do it well. How can you capitalize on a trend in your industry through a marketing infographic?
10. Shocking Single Mom Stats & Trends
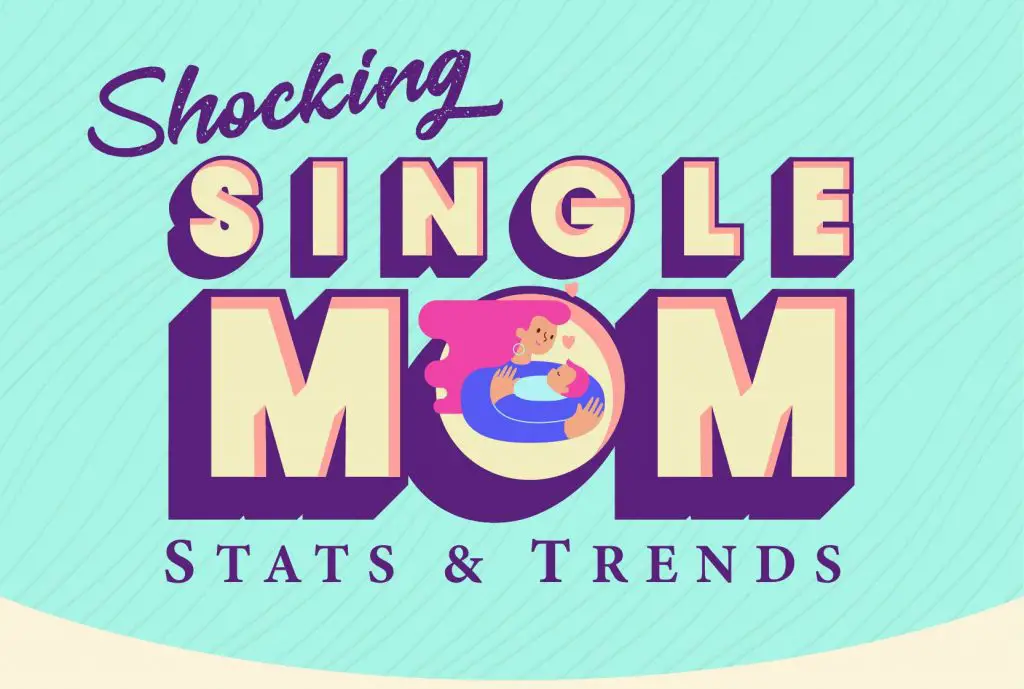
To make the case for any argument, it usually takes a combination of facts and stories. Providing compelling statistics for a single mother’s experience, with regard to both finances and demographics, is easy for donors to see in this infographic format. How can you use an infographic as an overview for an issue you care about?
11. Emotional Intelligence Is Crucial for Success in the Workplace by InitiativeOne
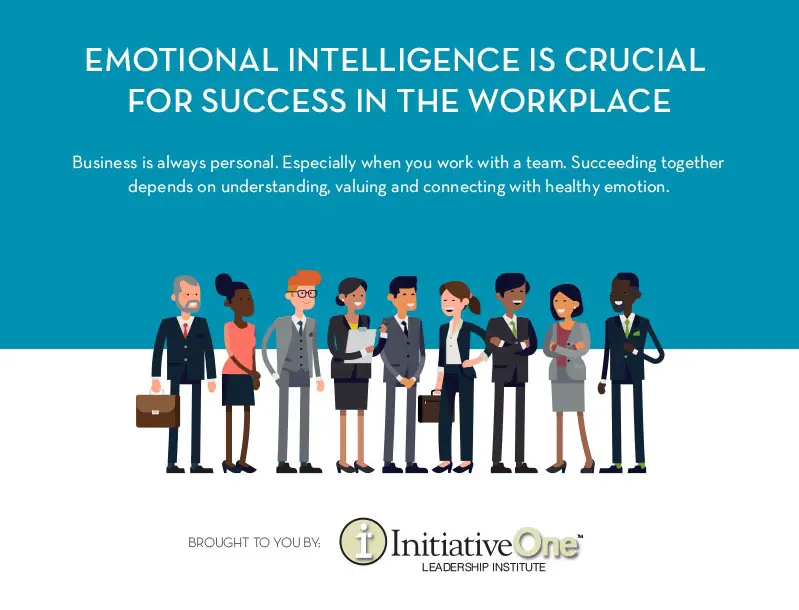
Emotional intelligence is a buzzword in today’s business world, but some companies are still trying to understand its relevance to them. Besides defining the term and helping readers understand why it’s important, this infographic explains the difference between EQ and IQ. How can you use an infographic to compare and contrast your company to your competitors, or discuss your own benefits and features?
12. Extravagant Easter Egg Decoration Ideas by Dudley’s

Traditions, celebrations, and holidays are something everyone looks forward to and holds dear. By giving a background on the history of Easter eggs and how they are used around the world, Dudley’s both informs and delights. How can you use an infographic to show your service or product’s relevance to people’s lives?
Don’t Wait: Start Testing Marketing Infographics for Yourself
Whether you were unaware of how marketing infographics could help your content strategy, needed a little convincing, or simply wanted a push to get you started, we hope this guide has given you what you needed.
There are a variety of benefits for your company, and several best practices to follow, but just remember one thing: When done well, marketing infographics can increase your qualified leads. And your sales.
If you’re ready to start using marketing infographics, but need some assistance, please let me know. We can help with everything from generating ideas to market research to outline and creation to execution. We believe these visual content tools are a terrific way for your business to grow, and we’d love to show you how.
Was this article helpful? Leave a comment below to share what you learned or what kind of infographic you’ll create first.